 |
|
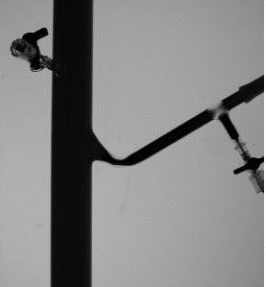
A validation study was carried out using a flow through phantom of a
renal artery. Even though the shape of the model is idealized, it was constructed
with dimensions taken from magnetic resonance angiography images of a patient
with renal artery stenosis. Pressure transducers were used to measure the
pressure drop across the renal stenosis.
 |
|
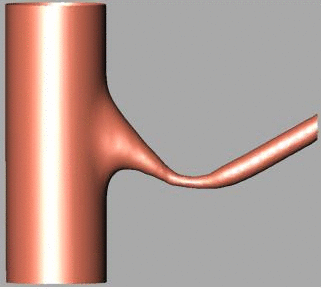
The geometrical model was reconstructed from a CT scan of the glass
phantom. The reconstructed diameters at the stenosis closely match direct
measurements on the glass model. Since the flow becomes turbulent, a boundary
layer or Navier-Stokes mesh was generated and the grid resolution was increased
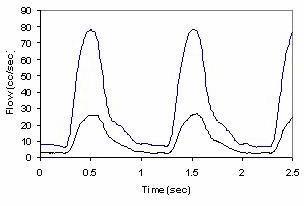
in the region distal of the stenosis. Pulsatile flow conditions that resemble
the flow waveforms measured in vivo using phase-contrast magnetic resonance
images were produced by a pulsatile pump. Flows waveforms were measured
and used to impose boundary conditions in the numerical model.
 |
 |
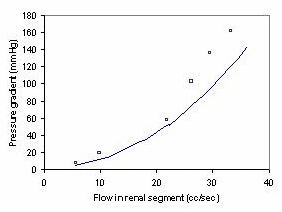
A series of steady flow runs were performed and the computed pressure
drops were compared to direct measurements under the same flow conditions.
In these cases the CFD model tends to yield higher values of the pressure
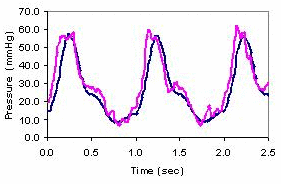
drops. In addition, a pulsatile experiment was conducted and numerically
modeled. The computed and measured pressure drops were in very good agreement.
 |
 |
A visualization of the pressure dristribution shows that a significant pressure drop occurrs at the renal stenosis.
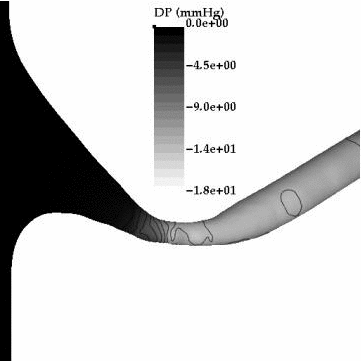
Pressure distribution under steady flow conditions
The following visualizations using streamlines colored according to the local flow velocity magnitude show the complex flow structure distal of the stenosis.
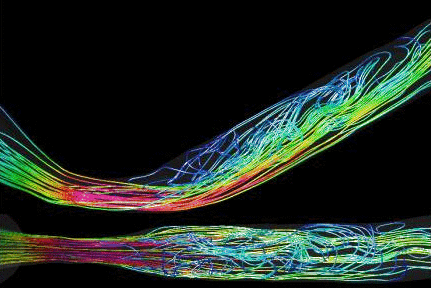
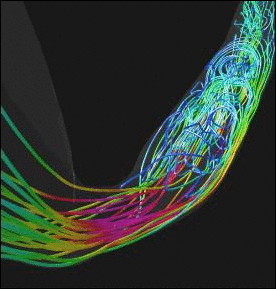
Flow visualization using streamlines colored with velocity magnitude