
Description:
This example shows the combination of traditional flow visualization with volume rendering techniques. In this case the blood flow in the circle of Willis was computed in a realistic model reconstructed from contrast-enhanced magnetic resonance angiographic (MRA) images.
The following figure shows the surface of the geometrical model used to compute the blood flow (red) simultaneously with a volume rendering of the anatomy from the MRA images.
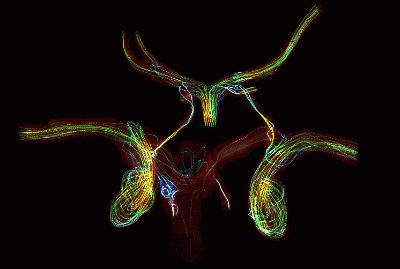
The next figure shows some computed streamlines (iluminated to enhance their 3D appearance) inside the computational model (rendered with transparency). This is the typical flow visualization carried out by a flow analyst.
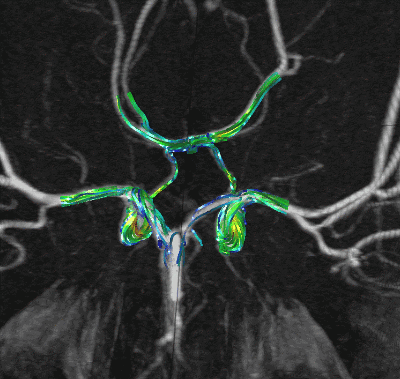
Finally the calculated streamlines are displayed simultaneously with the volume rendering of the anatomical images.
Observations: