Description:
Several basic flow visualization techniques are illustrated in this example. Here the incompressible inviscid flow around a tuna fish is calculated.
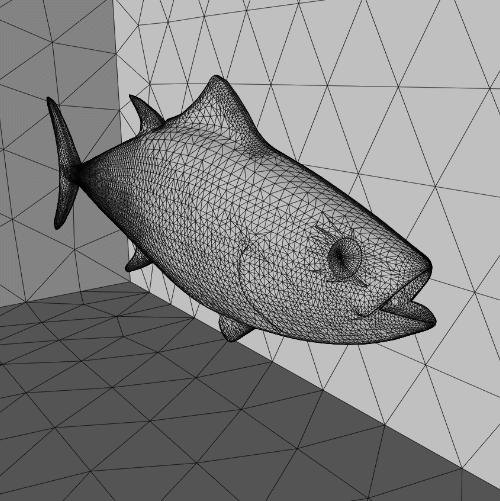
The following figure shows the surface of the unstructured grid used for the calculation.
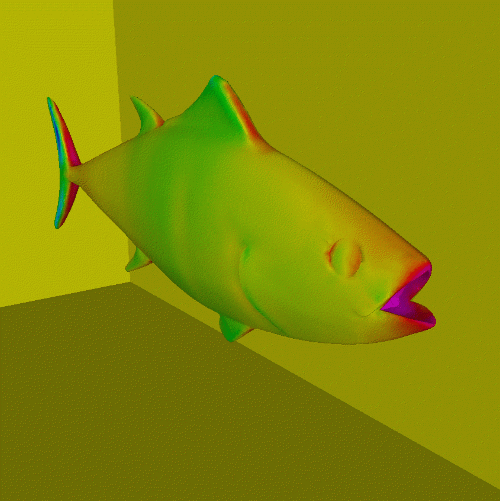
The next figure shows the surface of the fish shaded according to the pressure distribution.
Velocity contour lines on the surface of the fish are shown in the following figure.
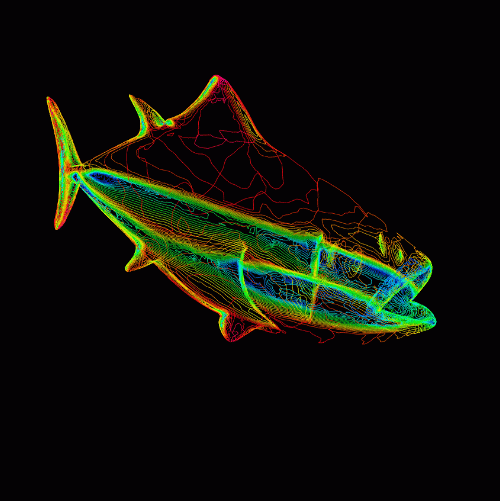
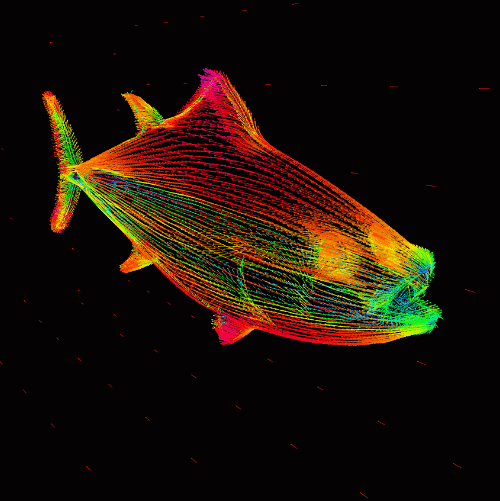
In the next figure velocity vectors colored according to velocity magnitude are shown on the surface of the fish.
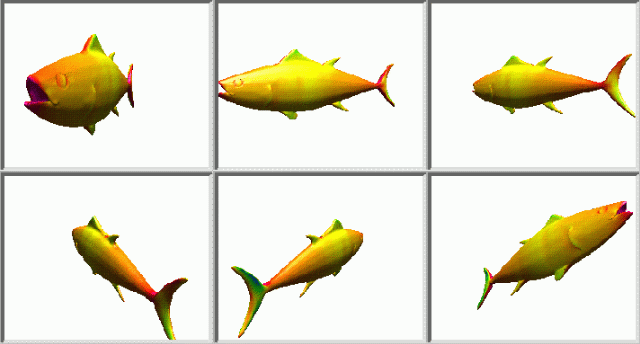
Finally, the next image shows the fish colored according to pressure from different views along the path of a navigation camera. Navigations of this type can be created interactively. The user specifies at each point along a path, the position of the camera, the target location (the direction in which the camera is looking at) and the vertical direction. Once the path has been created snapshots of the scene are taken from each point along the path (and interpolating in between). These images can then be used for an animation or for creating a movie.