Description:
This example shows some pictures from a simulation of a toxic release in the Tyson's corner area (close to where I live by the way!).
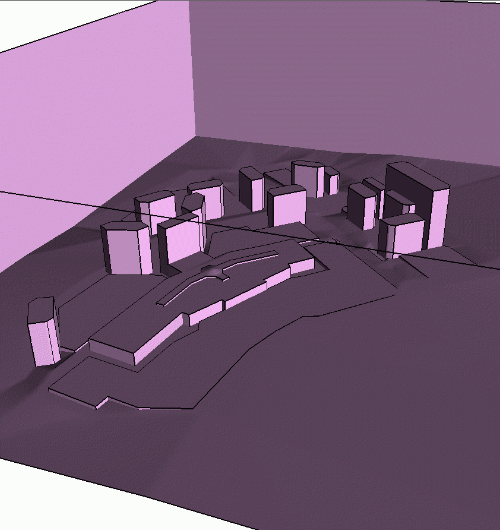
The following figure shows the geometry of the computational domain consisting in a terrain populated by several buildings. This geometry was reconstructed manually from blue prints.

The following figure shows the buildings shaded according to the wind pressure distribution.
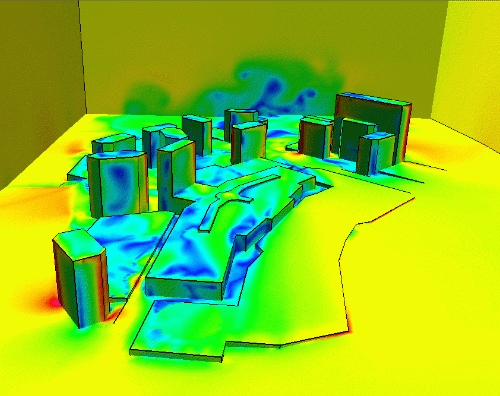
The next image shows the wind velocity vectors on the surface of the computational domain, colored according to velocity mnagnitudes.
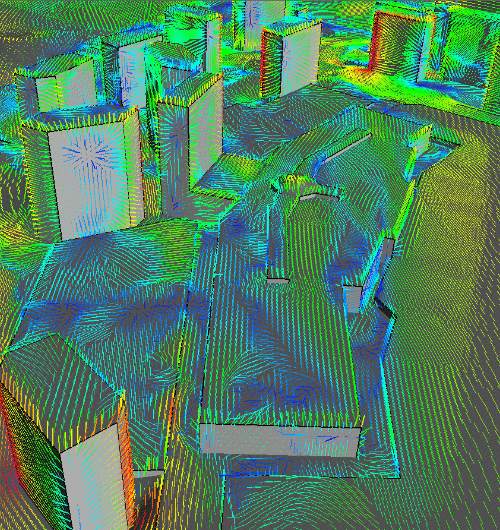
A close-up view of the velocity vector plot is shown in the next figure.
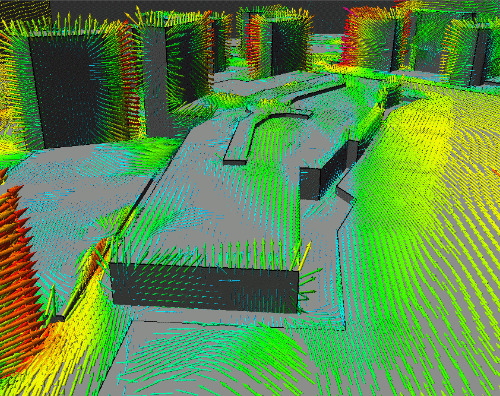
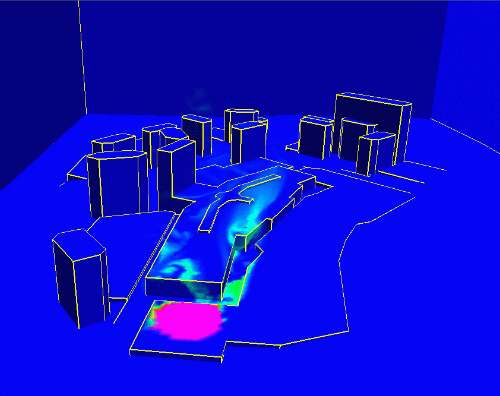
The following image shows the surface of the buildings colored with the toxic material concentration some time after the release.
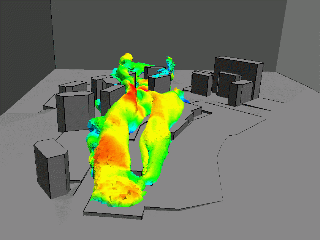
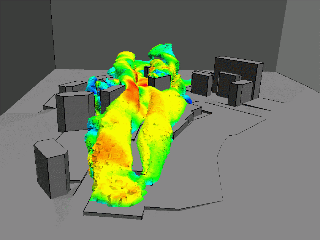
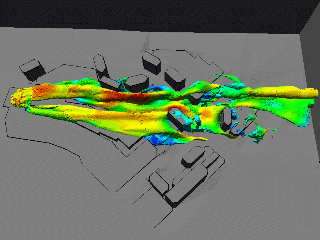
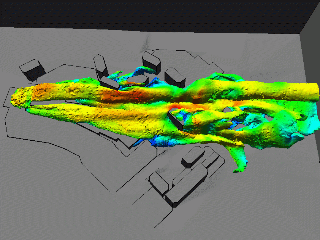
The following series of images show iso-surfaces of concentration at two different times after the release, colored according to the fluid velocity.
Observations: